Pepe Le Jew・@pepe_le_jew_・07/12/25
📊 Want a Technical Analysis on Your Favorite Token? 🔍💬
Looking to understand the next move on a token you're watching? Drop the token pair (e.g. $WOLFI/WAVAX) you'd like analyzed in the comments below! 👇
I'll break down:
✅ Support & resistance levels
✅ Trend direction
✅ Key patterns
✅ Potential bullish/bearish scenarios
Whether it’s a meme coin or a DeFi gem, let’s chart it up! 🧠📈
Start commenting your picks! 🗣️💥
@BrumBeezieRap @HoneIriman37384 @CryptoBeatRadio @LadyUturn @JusticeMr420 @JClassicMaestro @tantudditweets @mushmulaonly @kingteddy01999 @CLewechukw6015 @TheArenaApp @El_Lafranka @DelitfulReserve @BoboGorilla17 @S_I_Q_ @rakibakunji @MarkShatti31625 @wildblackee @CLewechukw6015 @NovrizalFr #CryptoCharts #TechnicalAnalysis #DeFi #Altcoins #ChartRequest
Pepe Le Jew・@pepe_le_jew_・07/13/25
BOI/WAVAX chart (4h timeframe) based on the image:
📉 Trend Overview:
Downtrend Dominance: The price has been in a steep downtrend since early July, falling from the 0.00007000 range down to 0.00003483.
Lower Highs, Lower Lows: Classic bearish structure. Any recovery attempts have failed to break above previous highs, confirming bearish control.
🔍 Key Observations:
1. Support Zone (0.00003000)
Price is hovering just above the 0.00003000 psychological support.
Repeated tests near this level suggest weakening but not yet a confirmed breakdown.
2. Resistance Zone (~0.00004000)
Minor recovery attempts faced rejection near 0.00004000.
Unless a breakout above this occurs with volume, any upside may be short-lived.
3. Volume Analysis:
Spikes in volume coincide with sharp sell-offs, suggesting panic or capitulation.
No sustained buy volume seen during consolidation – a red flag for bulls.
🔄 Current Price Action:
Bearish Engulfing Candle: The latest red candle is strong, with high volume, rejecting the prior attempt to rise.
Indicates renewed bearish pressure.
RSI (not visible but inferred from price movement) is likely nearing oversold, but no bullish divergence is evident yet.
⚠️ What to Watch Next:
Signal Bullish Case Bearish Case Support Retest Bounce off 0.00003000 with strong volume Breakdown below 0.00003000 could trigger further sell-off Volume Rising green bars = buyer interest Continued low or red volume = distribution Reversal Pattern Double bottom / bullish engulfing No pattern = trend continuation likely
🧠 Summary:
Trend: Strongly bearish
Momentum: Still favors sellers
Risk Level: High unless reversal signs show up
Next Major Support: 0.00003000 — watch this closely
Recovery Signal: Must reclaim 0.00004000 on strong volume @BrumBeezieRap @HoneIriman37384 @CryptoBeatRadio @LadyUturn @JusticeMr420 @JClassicMaestro @tantudditweets @mushmulaonly @kingteddy01999 @CLewechukw6015 @TheArenaApp @El_Lafranka @DelitfulReserve @BoboGorilla17 @S_I_Q_ @rakibakunji @MarkShatti31625 @wildblackee @CLewechukw6015 @NovrizalFr
Pepe Le Jew・@pepe_le_jew_・07/13/25
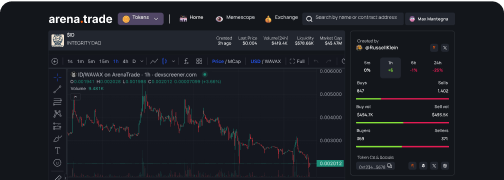
📊 Technical Analysis – $LADYCOQ Token
Platform: Arena.trade
Token: $LADYCOQ
Created: 17 days ago
Current Price: $0.0003066
Holders: 63
24h Volume: $13.88
Market Cap: $623
Bonding Curve Progress: 20.31%
Remaining to bond: 492.31 AVAX
🔍 Price Action & Volume Analysis
Early spike & steep decline: The chart shows an initial sharp upward movement followed by a prolonged, consistent downtrend. This is a common pattern for low-liquidity, hype-driven tokens where early buyers exit after profits.
Flatlining price: For the past few days, price action has become flat with very little volume, indicating low trader interest or exhaustion of buyers.
Low liquidity signals:
The recent candles are tiny and sporadic.
24h volume is only ~$13.88, which is extremely low and implies difficulty for users to enter or exit positions without significant slippage.
📉 Downtrend Indicators
Short-Term Momentum:
Negative across multiple timeframes:
1h: 0%
24h: -1.22%
7d: -11.02%
This confirms a bearish trend with no signs of current reversal.
Support Zone: Around 3.07×10⁻⁷ appears to be the current consolidation floor.
No clear resistance nearby** since recent highs were quickly rejected and not re-tested.
🛑 Risks and Considerations
Microcap: Market cap of $623 makes it extremely volatile and prone to manipulation.
Few holders (63): Indicates early-stage project or lack of adoption.
Low Bonding Curve Progress (20.31%): Could mean the project is still in a funding phase, but it also means low trust/liquidity buildup.
✅ Potential Opportunities
If a community-driven push or marketing event occurs, tokens at this phase may see high-percentage moves quickly.
Entry near the current floor could offer high R:R, but only if volume returns.
🧠 Conclusion
$LADYCOQ is currently in a low-volume, downtrending phase with little buying activity. The market is in a wait-and-see mode. This token would only be suitable for high-risk speculative entries, ideally with confirmation of a volume spike or price breakout above recent highs. @BrumBeezieRap @HoneIriman37384 @CryptoBeatRadio @LadyUturn @JusticeMr420 @JClassicMaestro @tantudditweets @mushmulaonly @kingteddy01999 @CLewechukw6015 @TheArenaApp @El_Lafranka @DelitfulReserve @BoboGorilla17 @S_I_Q_ @rakibakunji @MarkShatti31625 @wildblackee @CLewechukw6015 @NovrizalFr
Pepe Le Jew・@pepe_le_jew_・07/12/25
WOLFI/WAVAX 4H chart from ArenaTrade:
📊 Chart Overview (4H Timeframe)
Current Price: 0.001215 WAVAX
24H Change: +8.39%
Volume: 59.29K
🔍 Key Observations
1. Support and Resistance Zones
Support Zone: ~0.001000 – held multiple times as a floor.
Resistance Zone: ~0.001500 – price has failed to close above this several times.
Current Mid-Range Level: Price is consolidating just above 0.001200.
2. Price Action
After a steep decline in mid-June, price entered range-bound consolidation.
The current structure is forming higher lows and higher highs since early July — early signs of a short-term uptrend.
The latest candle shows a recovery wick, indicating buyer strength defending the 0.001120 area.
3. Volume Analysis
Volume has decreased during the consolidation phase, which is typical before a breakout.
A volume spike will be critical to validate the next move — especially near the 0.001500 resistance.
🔄 Potential Scenarios
🟢 Bullish Scenario
If price breaks and closes above 0.001500 with volume, the next potential target zone could be:
0.001800
Then towards 0.002000
🔴 Bearish Scenario
Rejection from current levels and a break below 0.001100 could send price down to:
0.001000 support
Then possibly revisit 0.000850
📈 Patterns and Signals
Mini Bull Flag/Ascending Triangle in progress (slightly slanted resistance at 0.001300).
Higher lows hint at accumulating pressure for breakout.
No major bearish divergence or overbought signals yet (assuming neutral RSI/MACD).
✅ Summary
Short-term Trend: Bullish consolidation
Bias: Slightly bullish unless support at 0.001100 is lost
Watch for: Breakout above 0.001300–0.001500 or breakdown below 0.001100
Pepe Le Jew・@pepe_le_jew_・07/10/25
📊 Token Overview – BARKY/WAVAX on ArenaTrade
Price (USD): $0.00001028
Price (WAVAX): 0.00005267
Liquidity: $31K
Market Cap: ~$102K
Volume (24H): $301K
Holders: 735
Buys/Sells (24H): 1,702 / 1,141
24H Price Change: ▲ +148%
📈 Chart Analysis (15-Min Timeframe)
🔹 Phase 1 – Accumulation (~06:00–08:00)
Low volume and small-bodied candles showing consolidation.
Possible accumulation zone, with whales or insiders entering quietly.
🔹 Phase 2 – Parabolic Move (~08:00–11:30)
Sharp vertical breakout — large bullish candles with rising volume.
Price spiked from around 0.00000500 to over 0.00003000.
Accompanied by high transaction volume, indicating strong buying pressure and FOMO.
🔹 Phase 3 – Blow-off Top and Correction (~12:00)
Formation of a long upper wick candle — classic sign of a blow-off top.
Rapid selloff followed, forming lower highs and lower lows.
Bearish momentum entered the market as price retraced aggressively.
🔹 Phase 4 – Recovery/Bounce (~14:30–15:30)
Price appears to find short-term support near the 0.00000800–0.00000900 level.
Currently recovering and forming higher lows, which may indicate a potential reversal.
RSI (not shown) likely approaching neutral or oversold territory.
🧠 Sentiment Snapshot
Bullish Momentum: Strong 24H gains (+148%), buy volume slightly exceeds sell volume.
Transaction Activity: 2,843 transactions in 24H, with over 620 market makers—suggests solid participation.
Whale Activity: One buy transaction was for $398.43 (≈ 39 million BARKY), indicating larger holders are still active.
🔍 Key Patterns & Indicators
IndicatorSignalVolume SpikeConfirmed the breakout during the parabolic runBearish EngulfingLikely near top — reversal confirmationRounded Bottom FormingPrice appears to be attempting a recoverySupport ZoneAround 0.00000850–0.00000900ResistanceNear 0.00001500, previous breakdown zone
⚠️ Risks
Extremely volatile: Price dropped significantly after peak.
High speculation: Chart behavior aligns with meme or micro-cap pumps.
Still in price discovery: Project launched recently (only 735 holders).
Potential exit risk if recovery fails near prior resistance.
✅ Conclusion
BARKY is exhibiting classic pump-and-correct behavior. The current setup shows signs of stabilization and a potential second leg, but any entries should be made with tight risk management. A confirmed break above 0.00001500 with strong volume could trigger another rally, while a break below 0.00000900 may invalidate bullish structure. @BrumBeezieRap @HoneIriman37384 @CryptoBeatRadio @LadyUturn @JusticeMr420 @JClassicMaestro @tantudditweets @mushmulaonly @kingteddy01999 @CLewechukw6015 @TheArenaApp @El_Lafranka @DelitfulReserve @BoboGorilla17 @S_I_Q_ @rakibakunji @MarkShatti31625 @wildblackee @CLewechukw6015 @NovrizalFr